

System
Public Graph

A living representation of the world's scientific knowledge, assembled for the first time as one interconnected system and built for the public good with a global community of systems thinkers

Currently in closed beta with select partners. Full public launch in Fall 2026.

System is a Public Benefit Corporation with a purpose to relate everything, to help the world see and solve anything, as a system.

Our belief in open science and our organizational values are codified in our charter, and our commitment to always keeping the System Public Graph freely available for non-commercial use.

The System Public Graph is a snapshot of a subset of the System Graph, a domain-agnostic, multi-scale graph with a scientifically-established finding as its atomic unit.

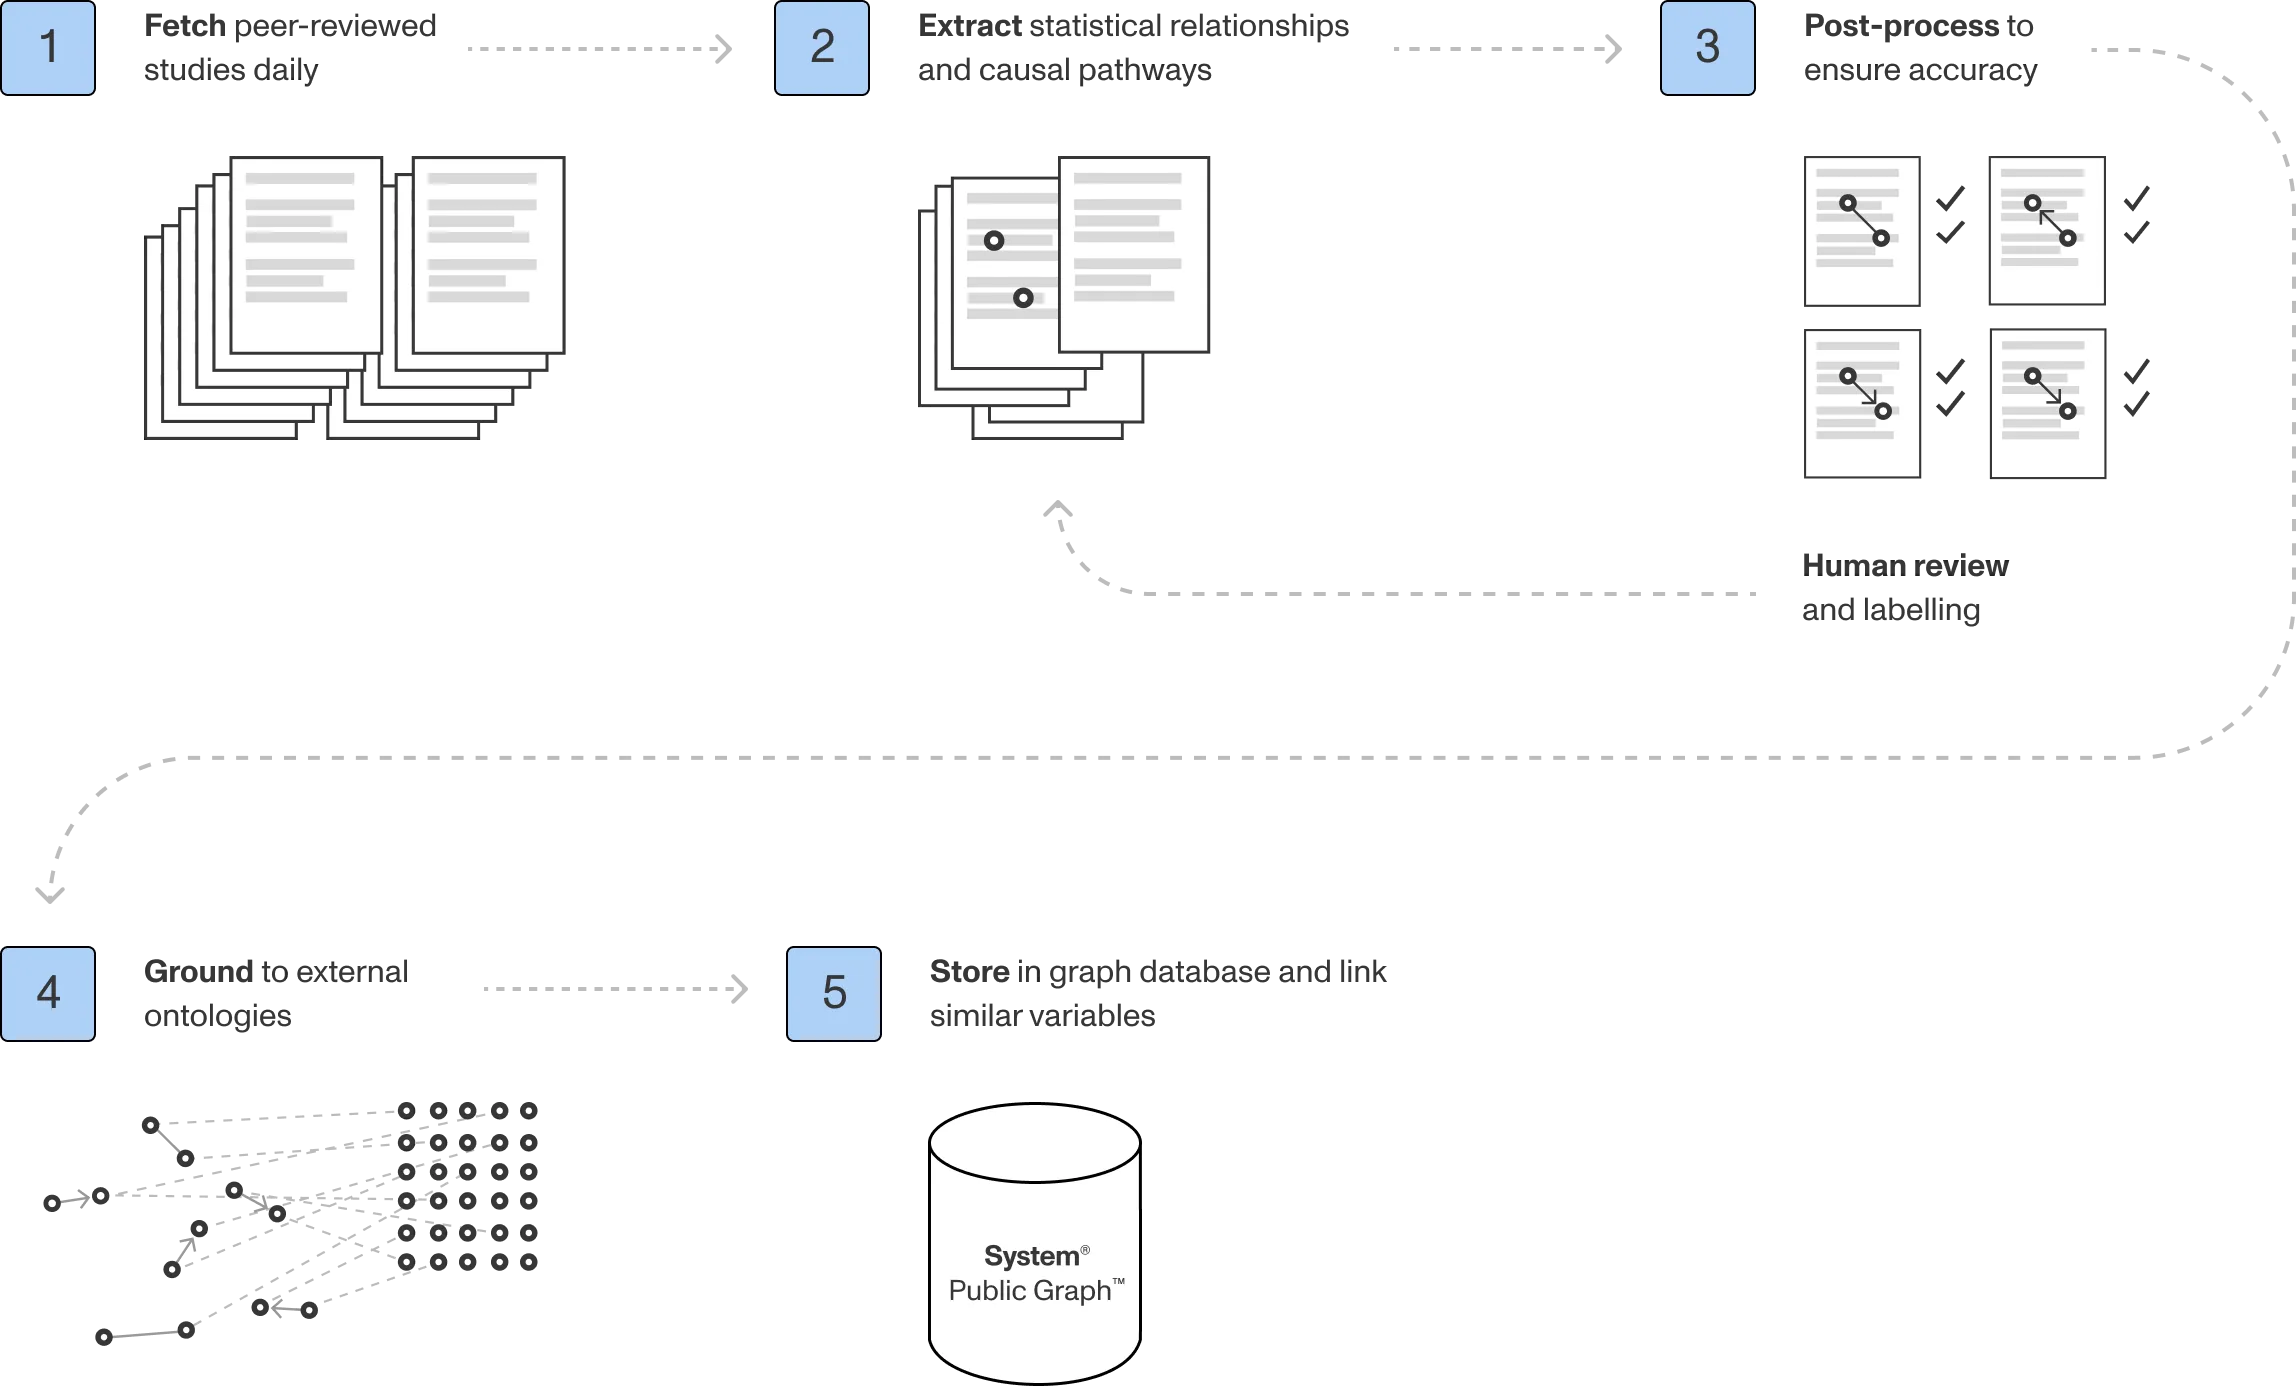
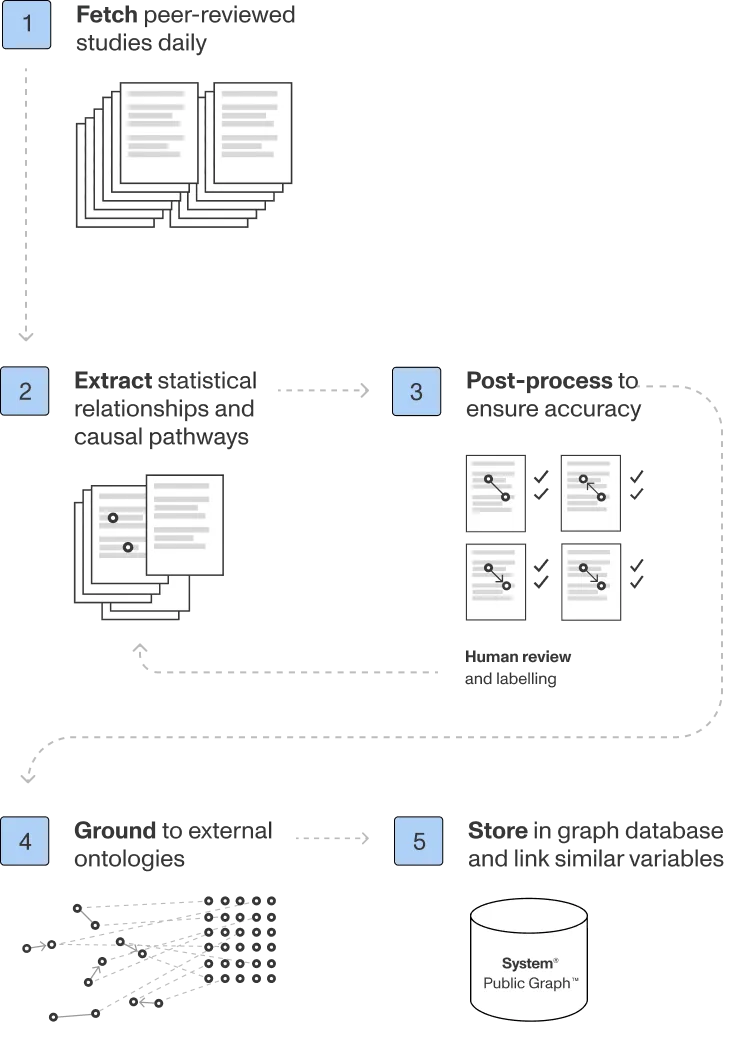
Updated daily with the freshest scientific evidence, the System Graph uses AI to extract, ground, and link findings from verified sources like peer-reviewed studies and expert-curated databases.

This generates millions of rich, quantitative relationships that cut across sources and fields from health, biology, climate, economics, and beyond.

Contents of the System Public Graph are derived only from open, publicly available sources.

How it works

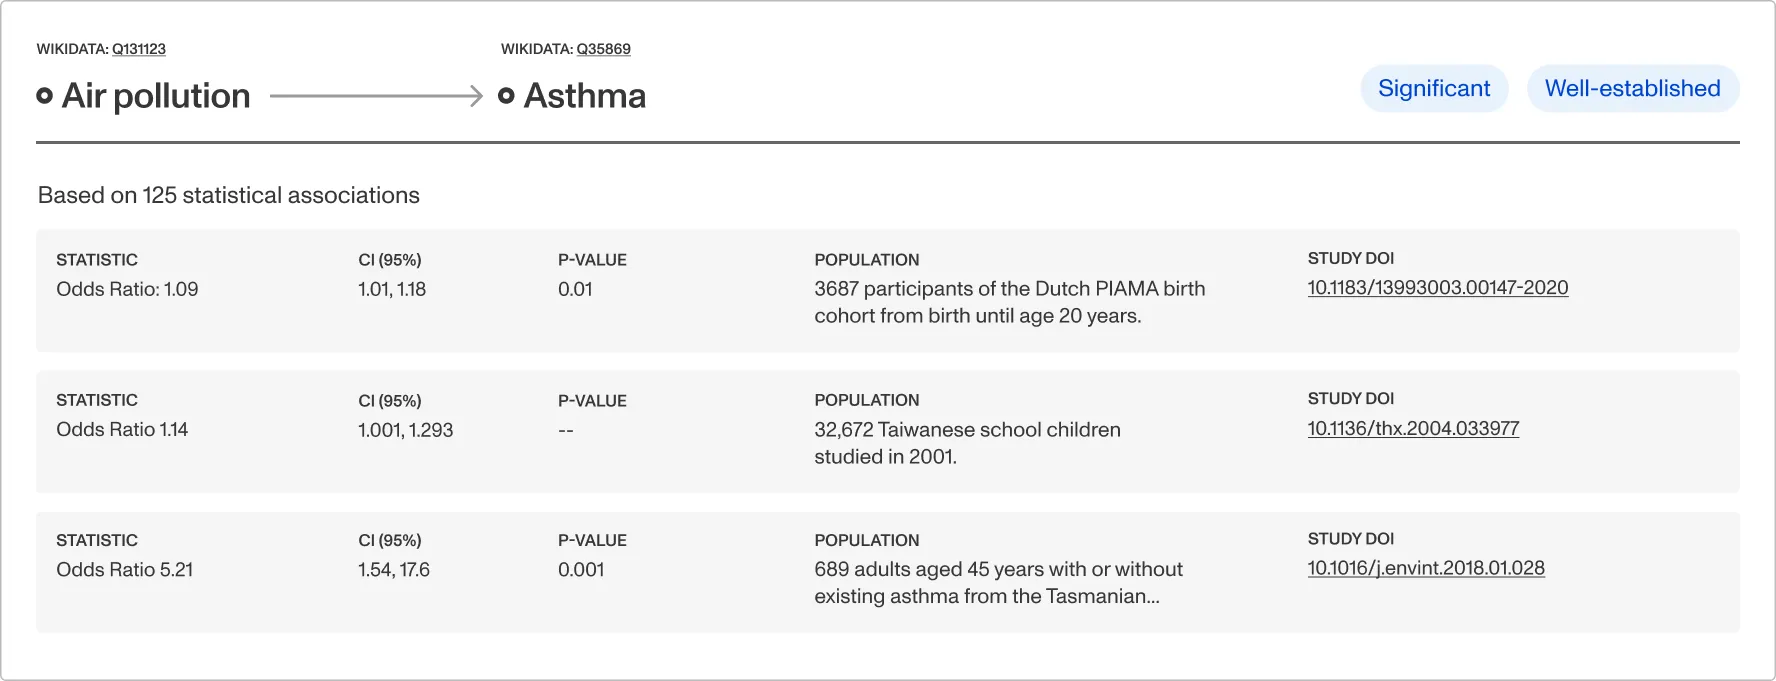
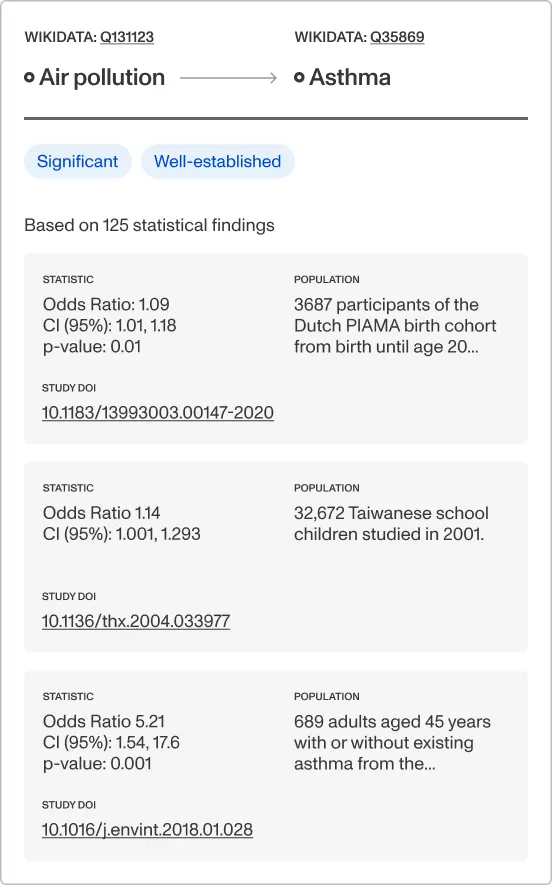
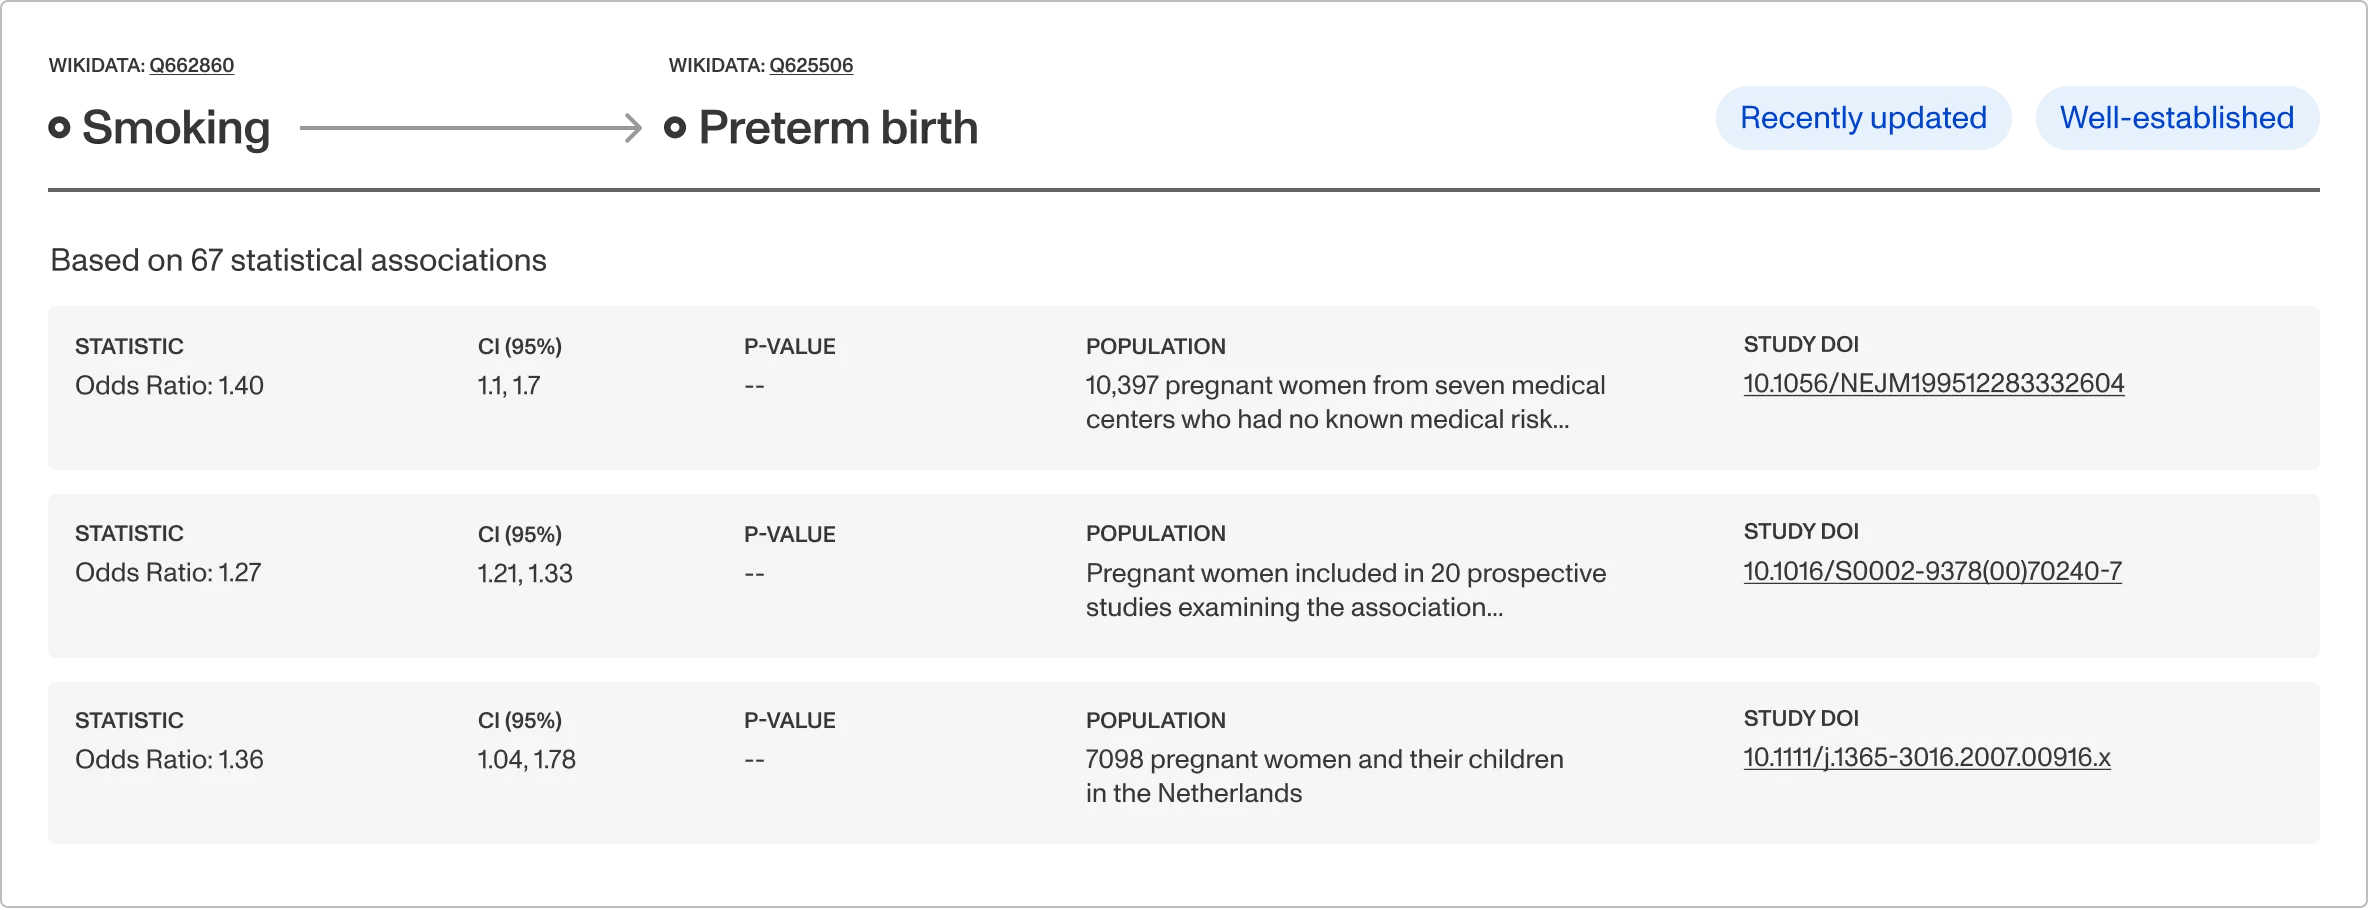
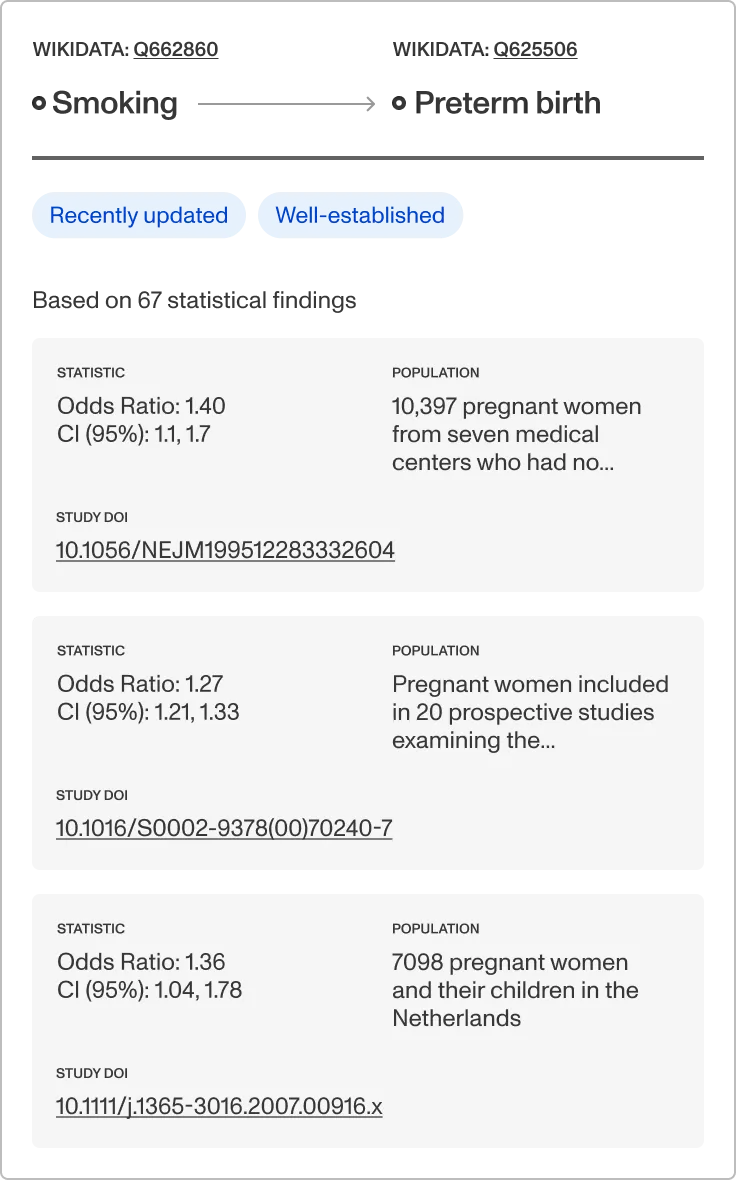
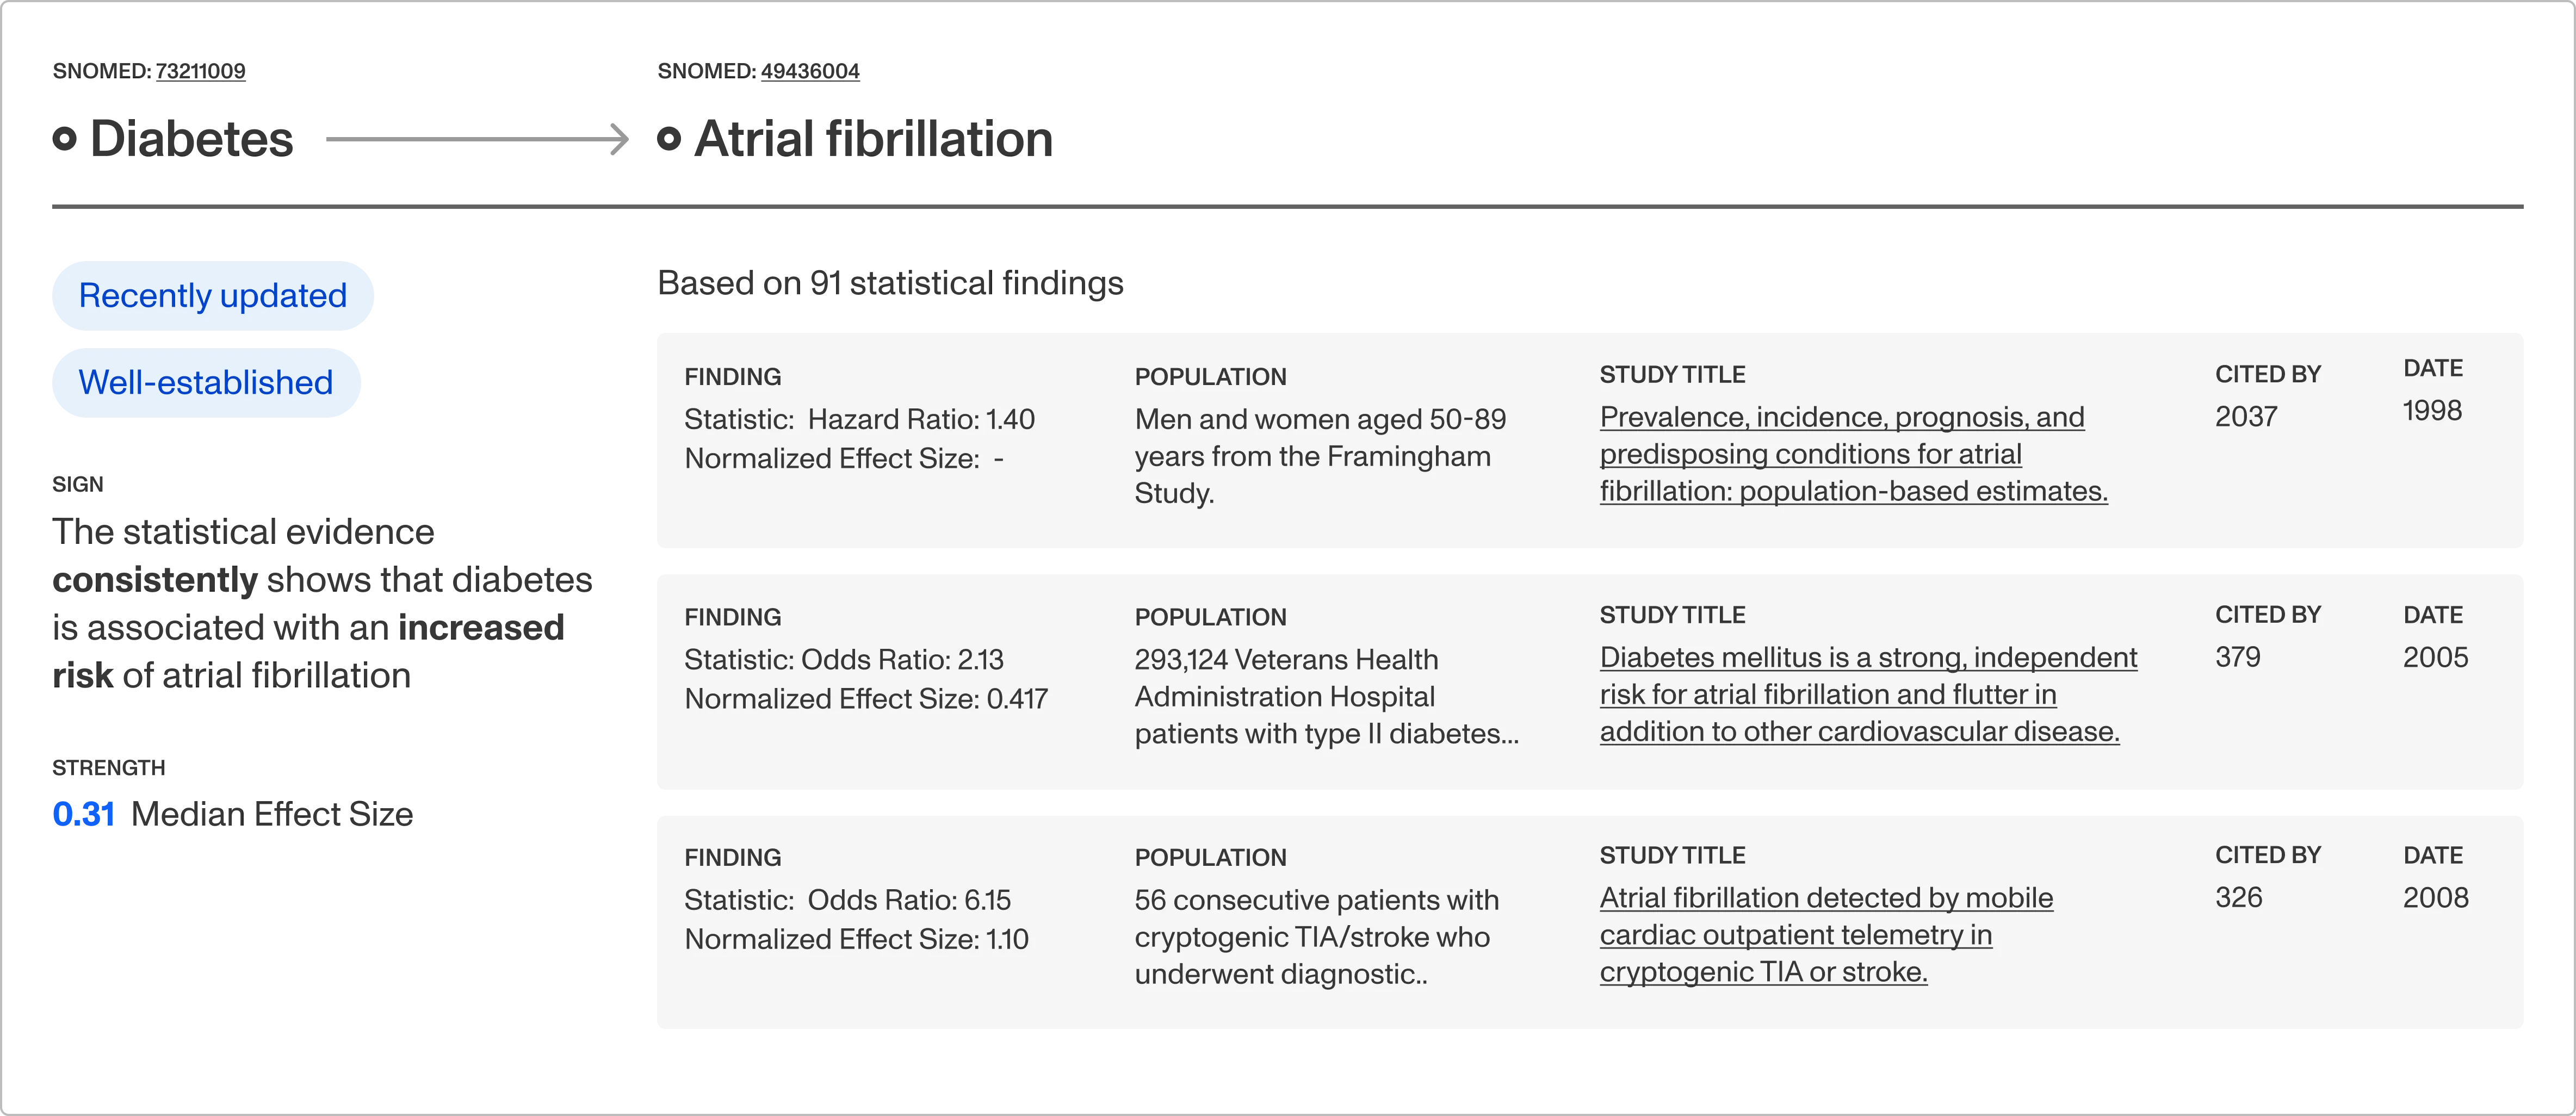
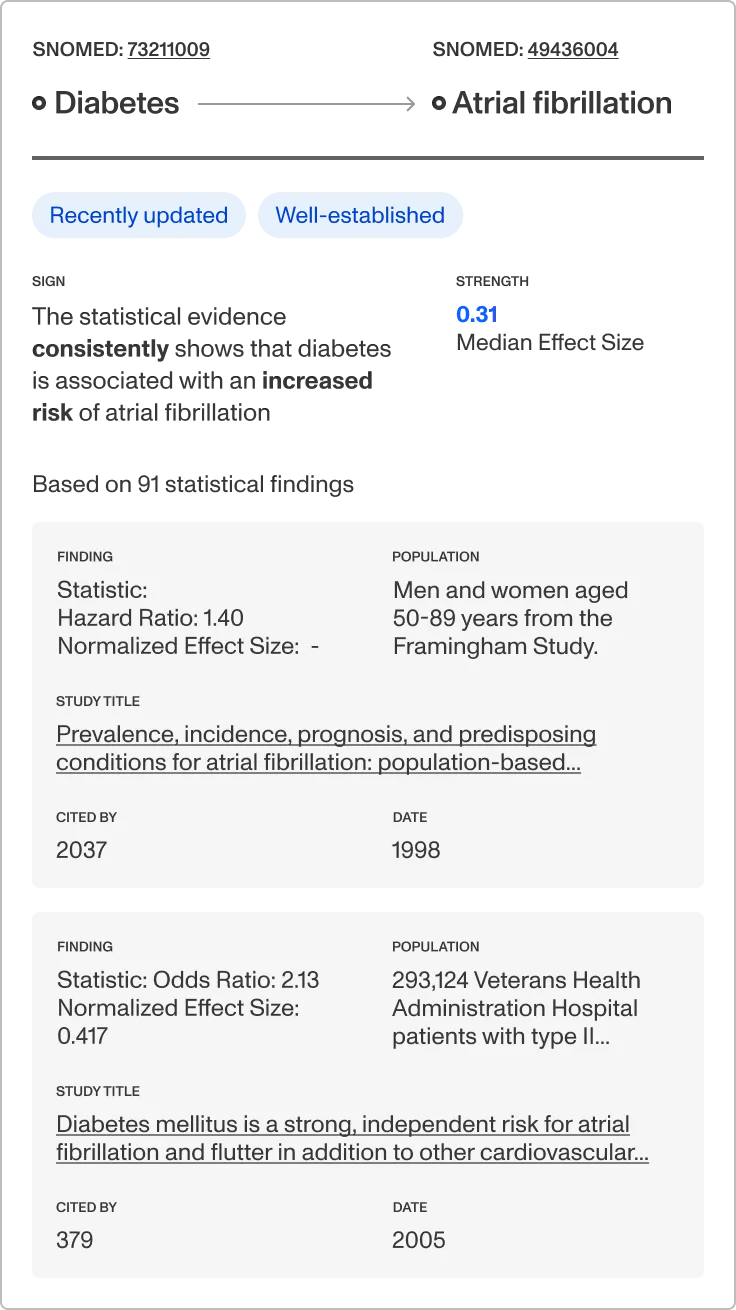
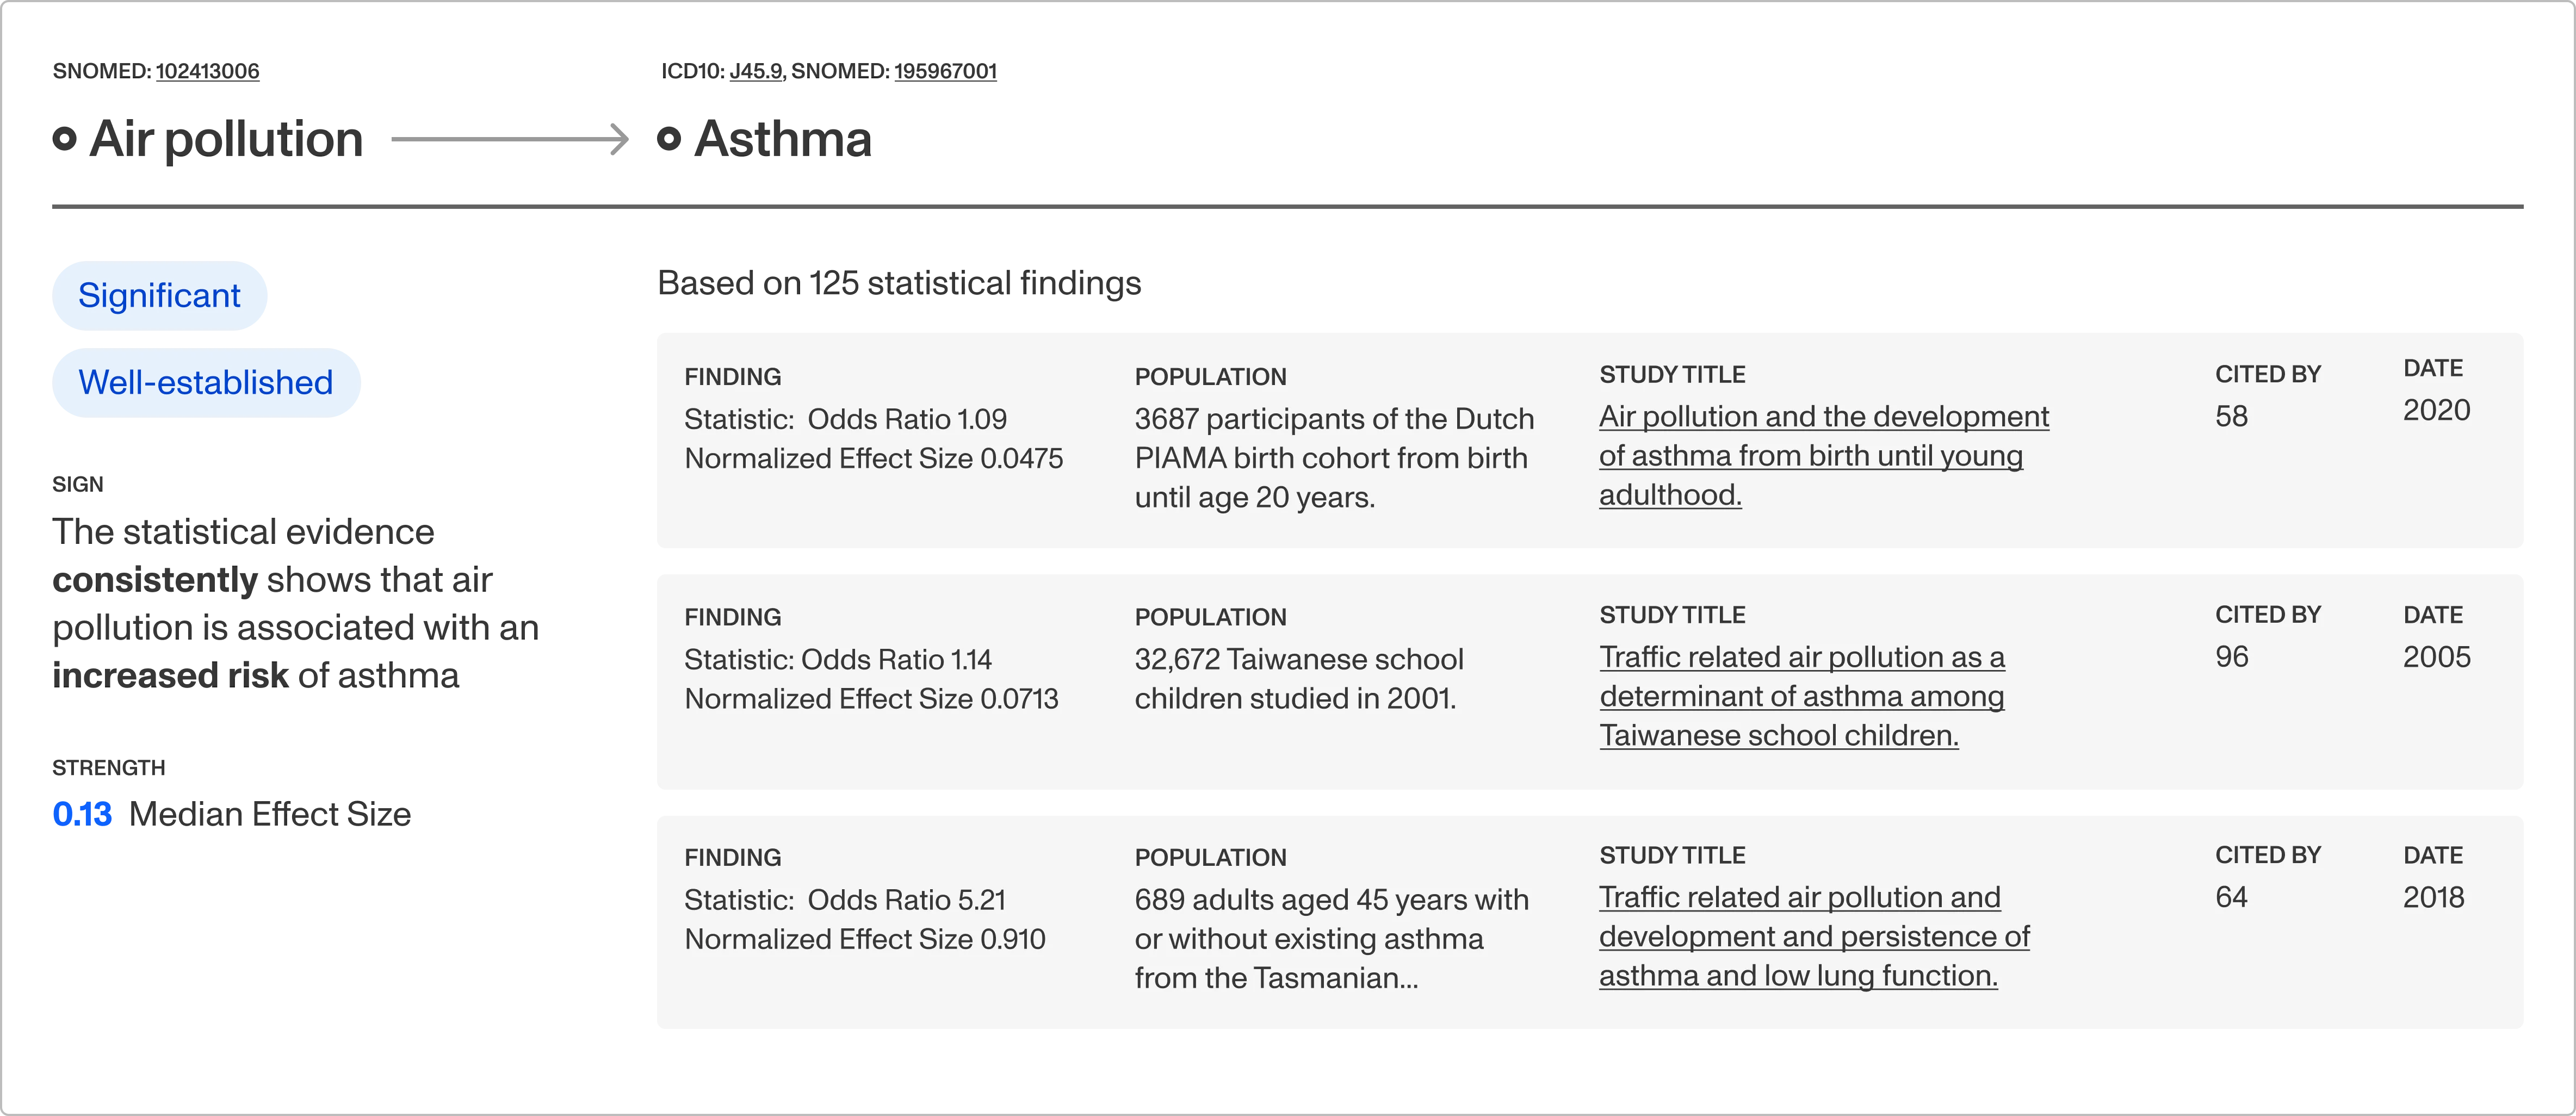
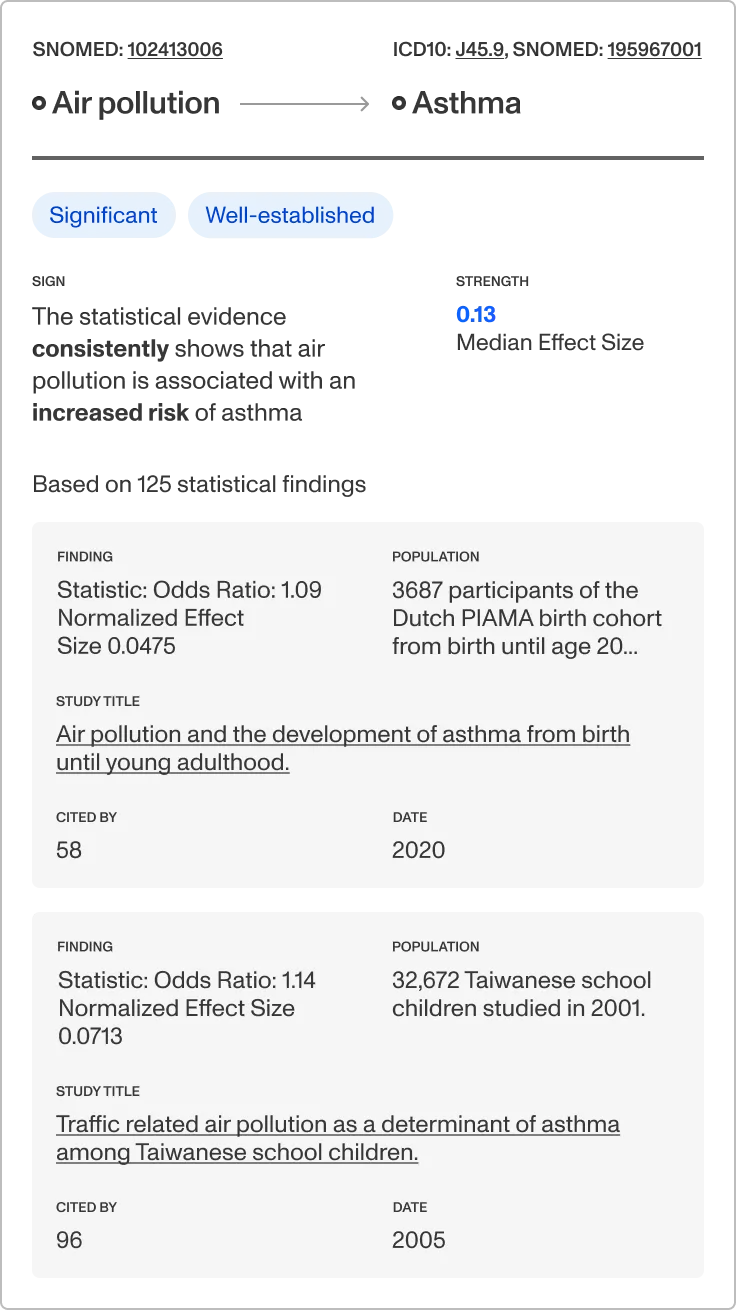
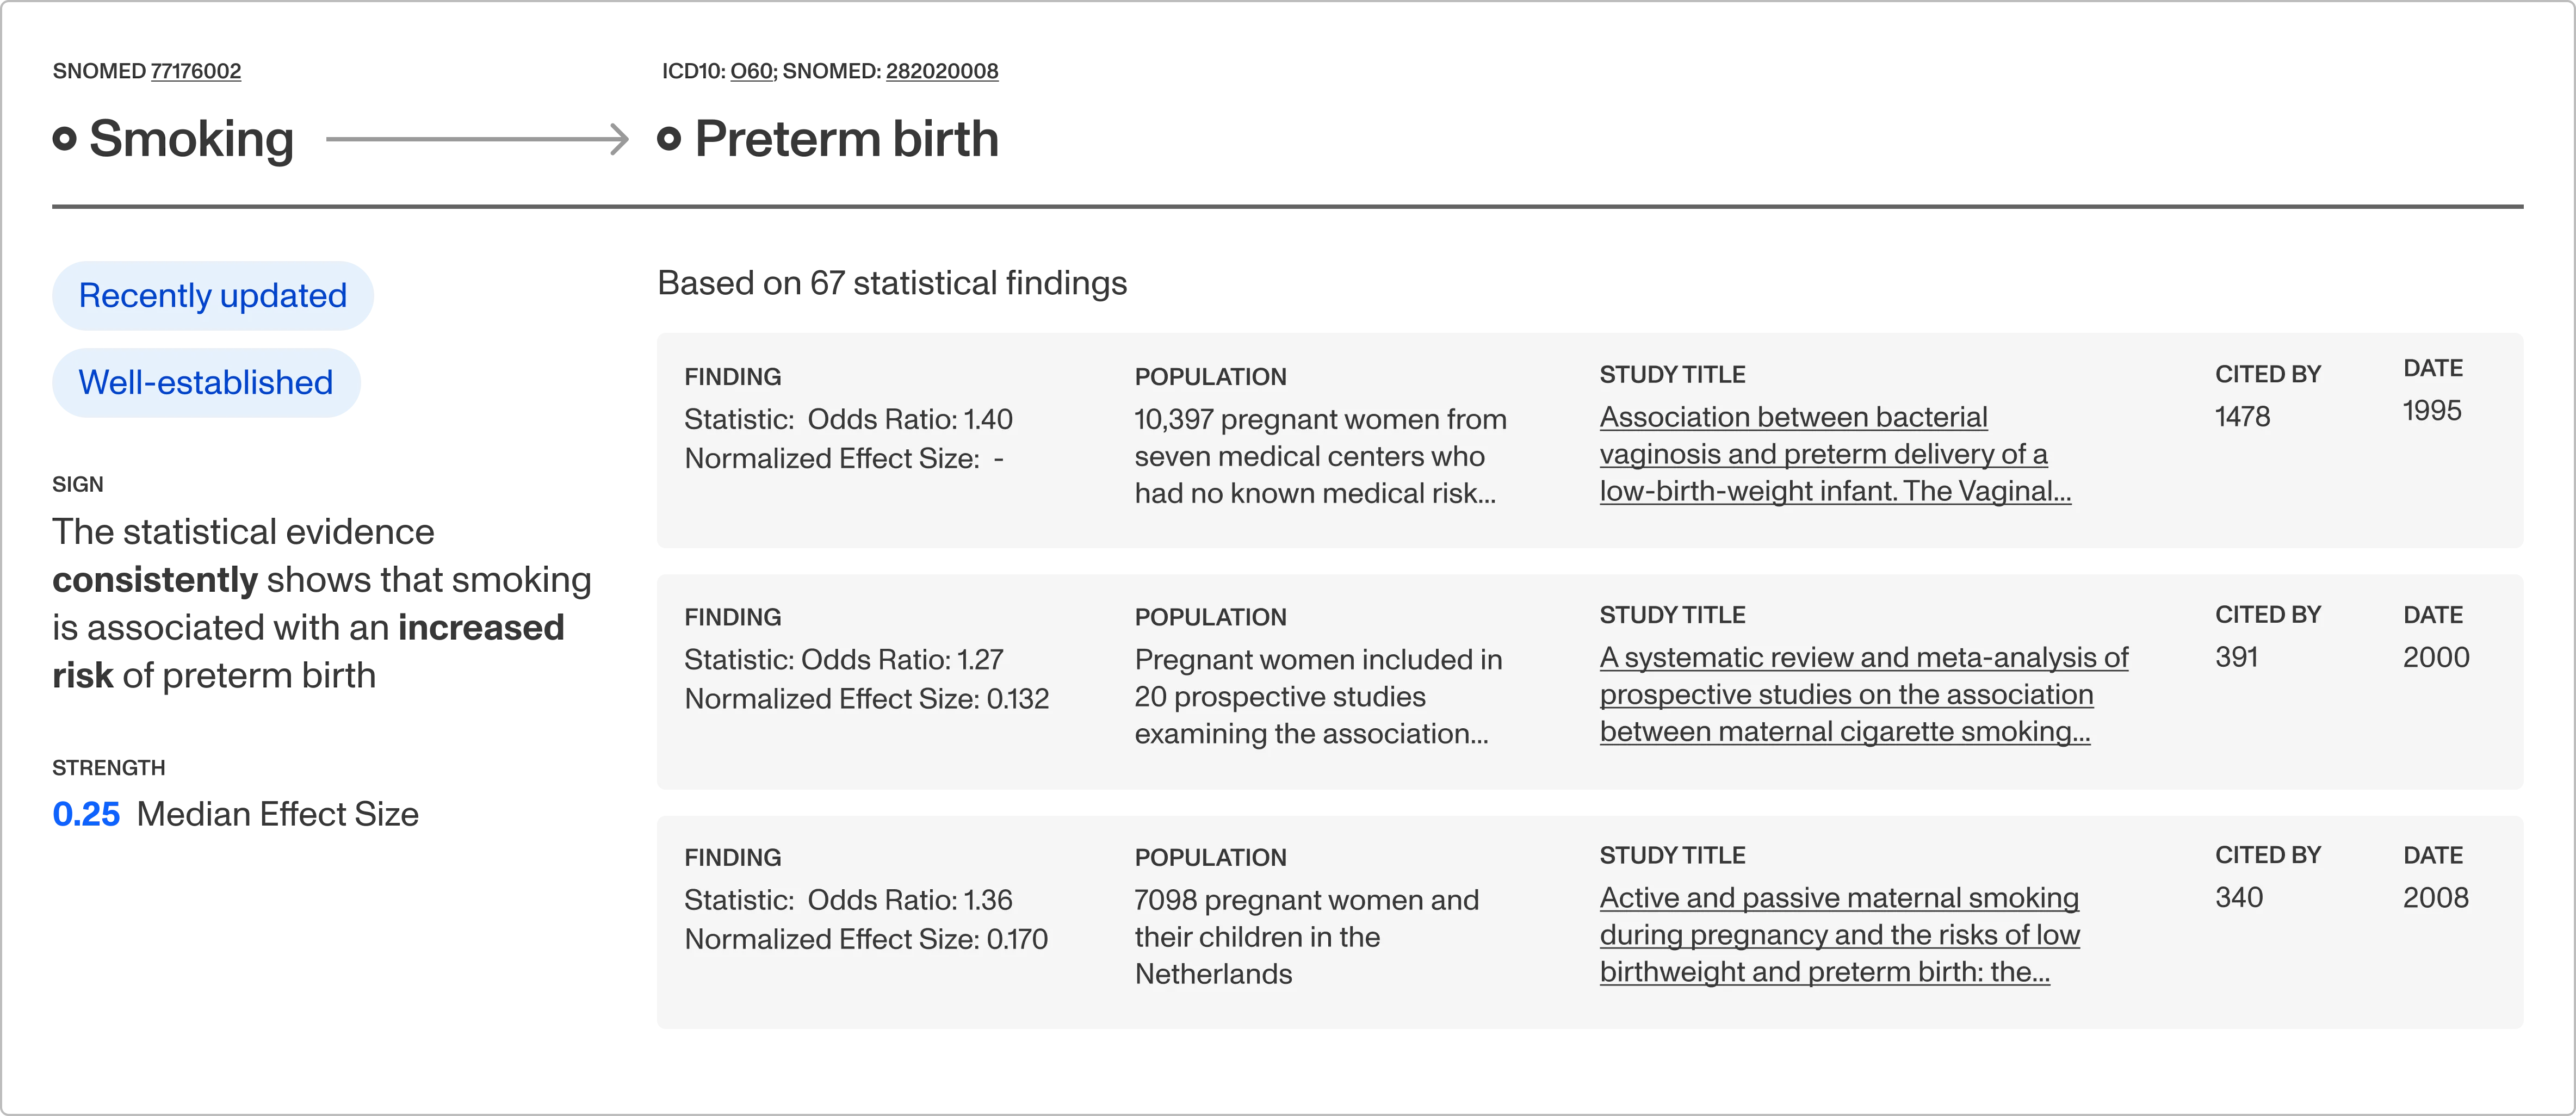
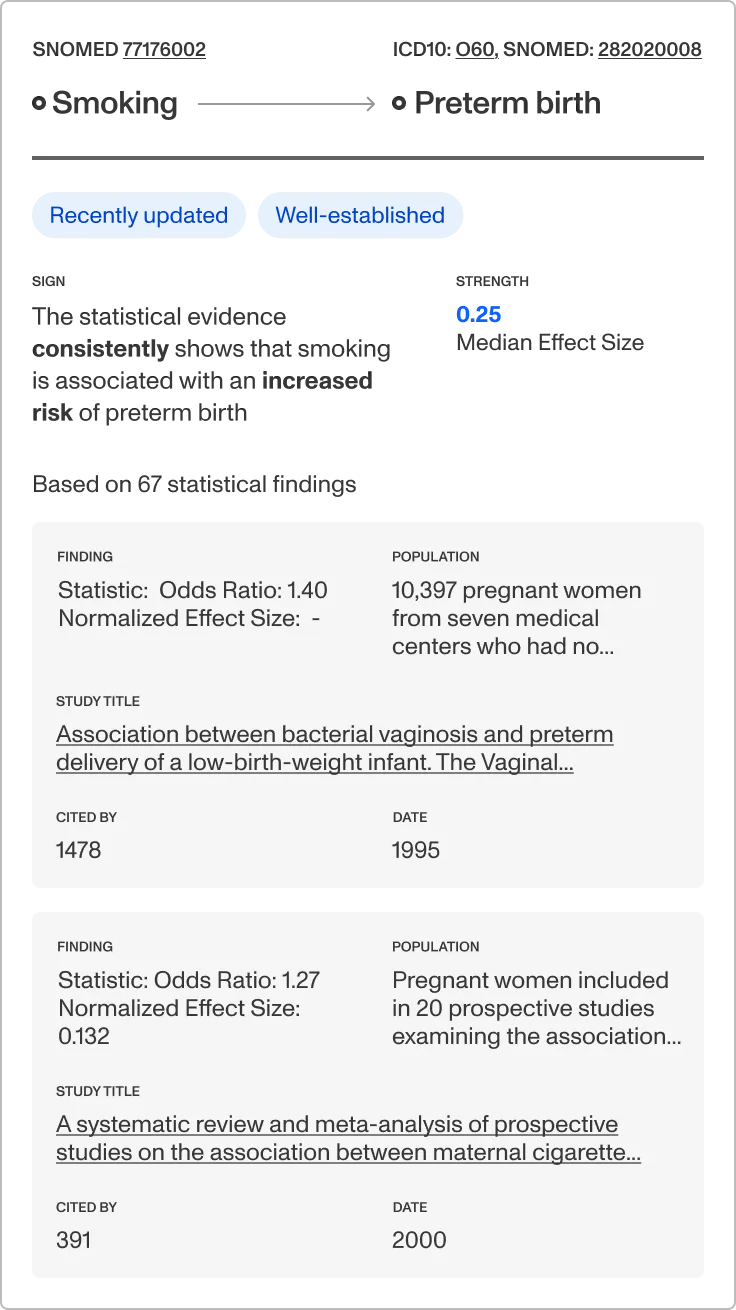
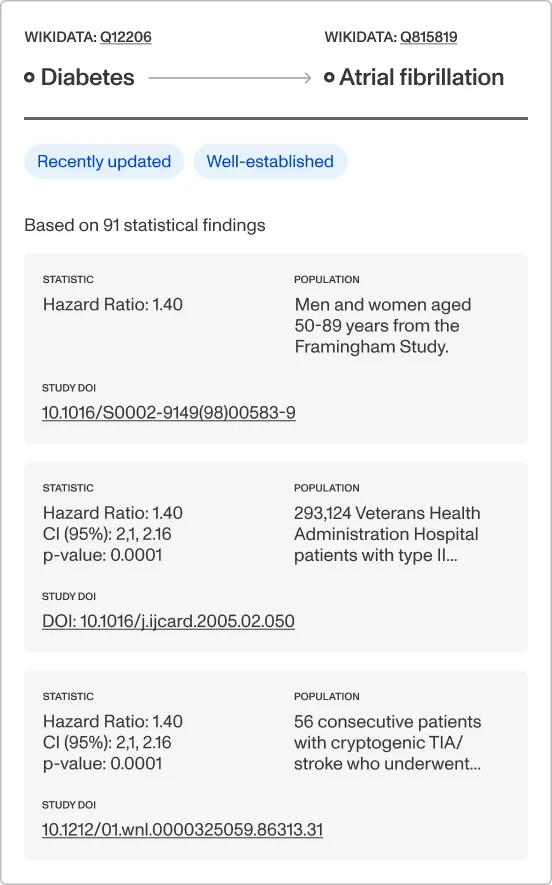
The atomic unit of the System Public Graph is a statistical association between variables, extracted from a verified source.

Release notes

Integrating Retraction Watch Database with System Graph

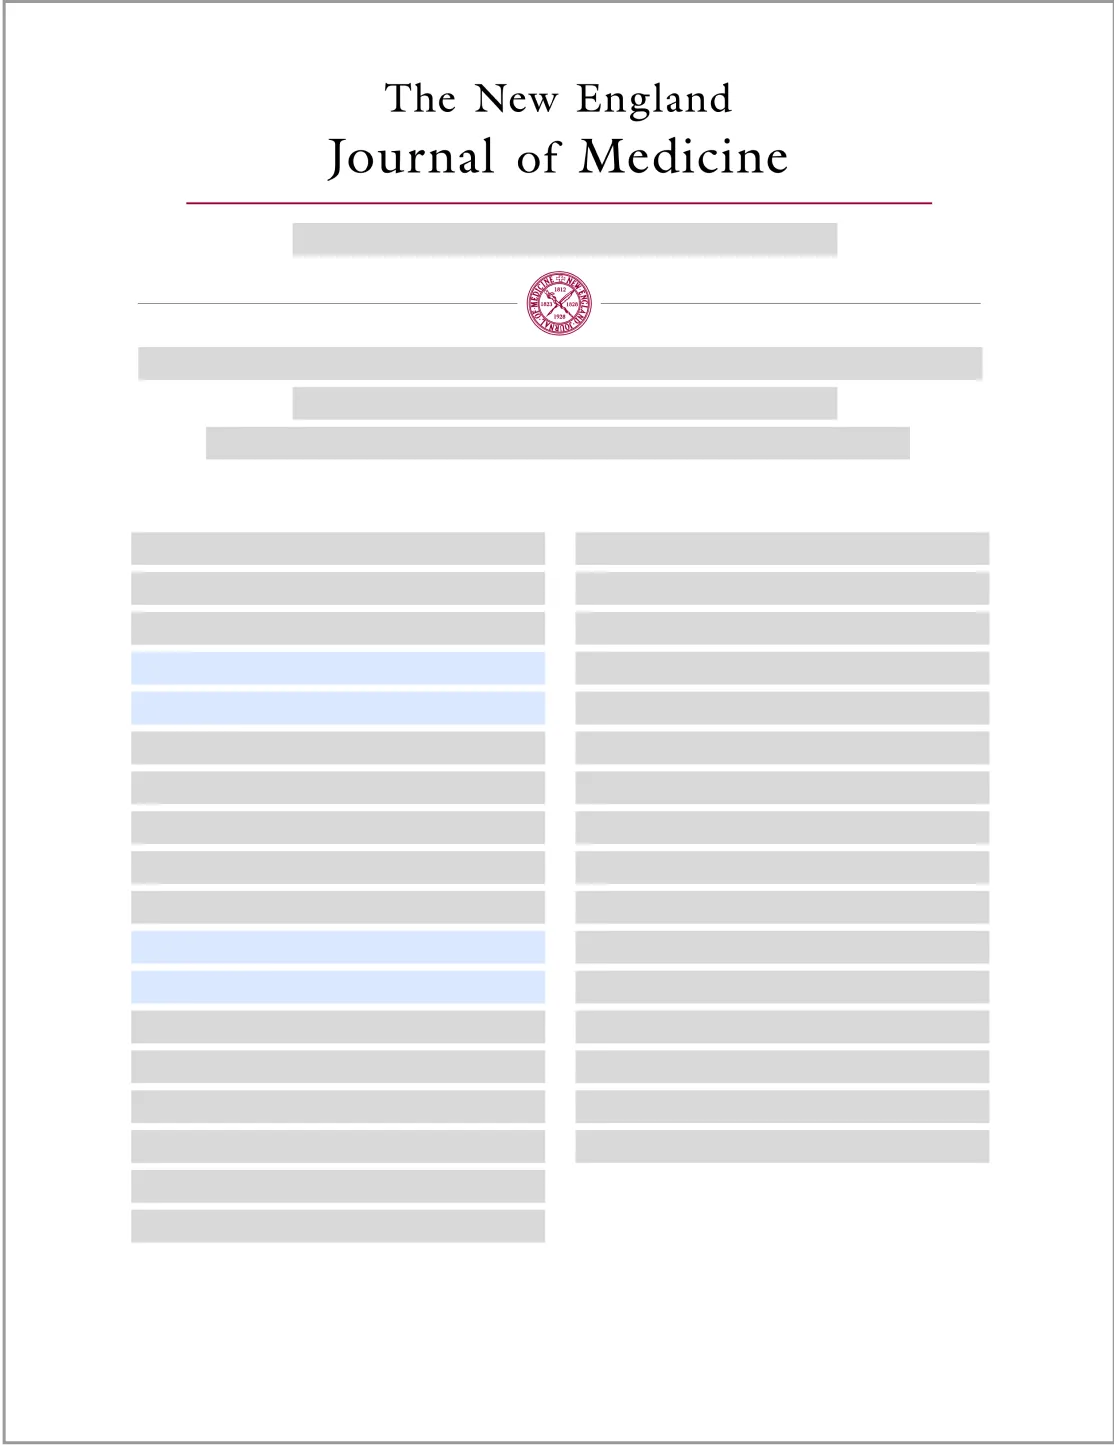
Study
Type-Specific Persistence of Human
Papillomavirus DNA before the
Development of Invasive Cervical Cancer
cited by
473
journal
The New
England Journal
of Medicine
publish date
11/25/1999
variable 1
Positive test for human papillomavirus DNA
variable 2
Development of invasive cervical cancer
Population
118 women in Sweden who participated in a population-based screening program for cancer of the cervix from 1969 to 1995.
Statistics
Odds Ratio 16.400
p-value = 0.001
95% CI (4.400 to 75.100

Using AI, the System Public Graph extracts, grounds, and links findings from verified sources like peer-reviewed studies and expert-curated databases.

This generates millions of rich, quantitative relationships that cut across sources and fields.
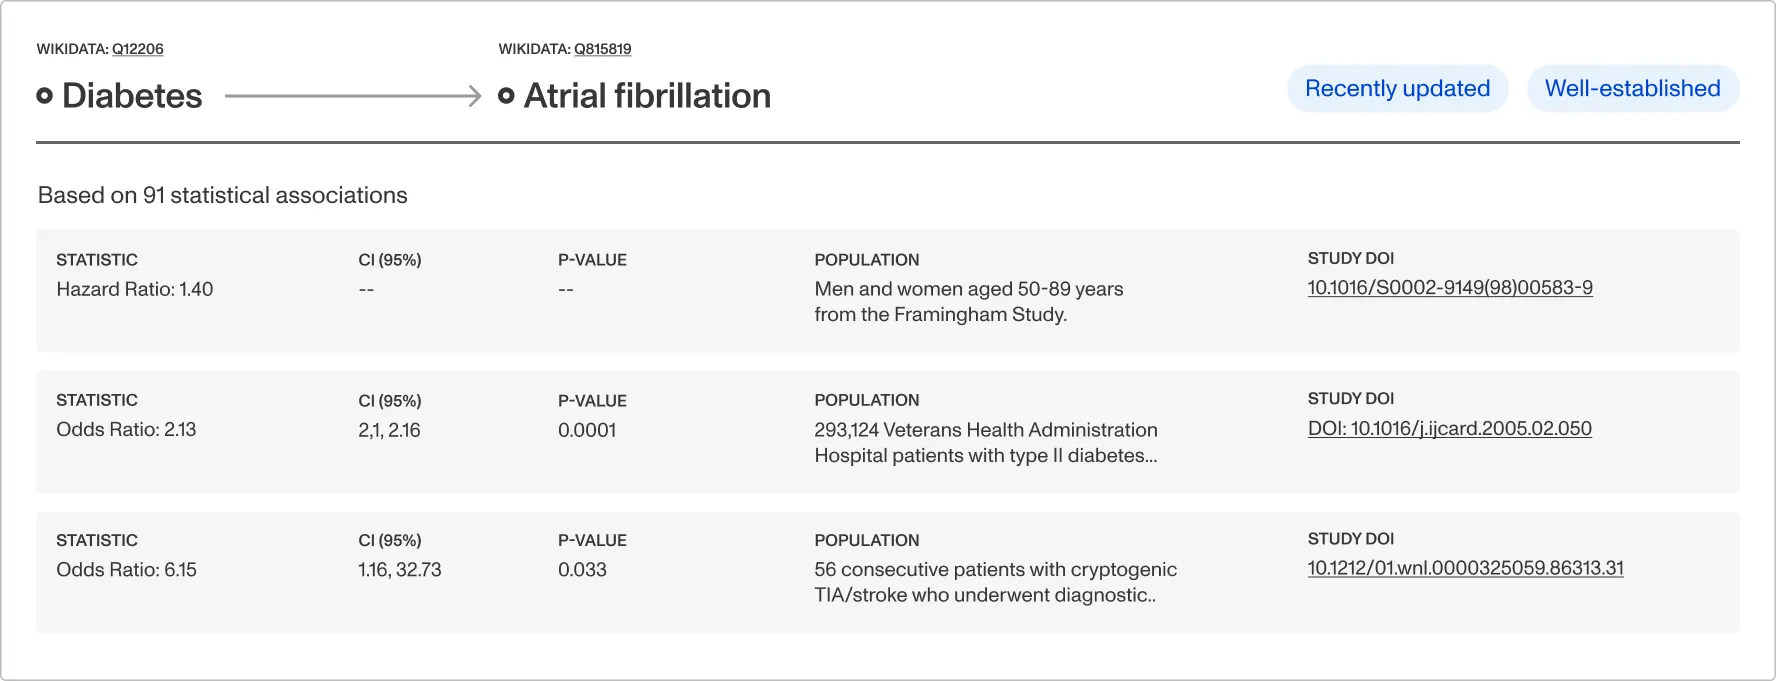
This generates millions of rich, quantitative relationships that cut across sources and fields.
Air pollution as a system

A visualization of how the System Public Graph models relationships between air pollution, health conditions, and social determinants of health.

Available to the public in Fall 2026

Ready to see health as it truly is—connected, dynamic, and deeply intelligent?